Tuesday, June 23, 2009

REPORTS Introduction


Introduction

In this case study we look at reports, which will show you how to enhance your skills in using Oracle Report Builder.

In these Hands-On, your client is a stock broker that keeps track of its customer stock transactions. You have been assigned to write them reports based on their reports layout requirements.


Before using the Report Builder tool

When you use the Report Builder tool, there are few modules that you may use them over and over. They are basics for your understanding how to use the tools.


Object Navigator

In the Report Builder tool, use the Object Navigator window, to view report components and navigate through the report objects. It gives you a hierarchical listing of all the modules open in your current session. You use this listing to navigate to, and work on, those objects. It gives you access to all database objects you own or have grant to, as well as a list of all the built-in functions and procedures you can use in Oracle Form Builder. Clicking on the plus sign next to an object in the Object Navigator will expand the object and clicking on the minus sign will collapse the object. Within the Object Navigator window, you have:

· Reports

· Templates

· External SQL Queries

· PL/SQL Libraries

· Debug Actions

· Stack

· Built-in Packages

· Database Objects.


Reports Object

In the Reports object, you have other important objects that are very handy to create, delete, and modify a report such as Live Pre-viewer, Data Model, Layout Model, Parameter Form, Report Triggers, Program Units, and Attached Libraries.

· Live Pre-viewer

· Data Model

· Layout Model

· Parameter Form

· Report Triggers

· Program Units

· Attached Libraries

Live Pre-viewer

You use the Live Pre-viewer object to view what the report will look like when it is executed.


Data Model

You use the “Data Model” to display the data content and layout appearance of the report. It’s very important when you use this object that you understand SQL statement and relationship between tables such foreign key and primary key.


Layout Model

You use the Layout Model object to show you how your report will appear. When you run your report, Report Builder fills in the objects in the Layout Model with actual data. The Layout Model will show you several types of layout objects and the relationships that exist between them. The Layout Model uses symbols and graphical representations to show these relationships. You can add, modify or delete part of your layout from here.


Parameter Form

You use Parameter Form to define, remove, and modify your report parameters. You will use the “Parameter Form Builder” tool to design your runtime parameter form. There are two types of parameters: user parameters and system parameters.


User Parameters

“User parameters” will be used to manage the behavior and output of your reports.


System Parameters

“System parameters” will be used to manage the report runtime behavior of your reports such as defining your output destination. Remember that when you run your report, the Runtime Parameter Form will be appeared.


Report Triggers

You use Report Triggers to define PL/SQL to fire at various points during the execution of your report. You will have:

· BEFORE REPORT,

· AFTER REPORT,

· BETWEEN PAGES,

· BEFORE PARAMETER FORM, and

· AFTER PARAMETER FORM.

Program units and Attached Libraries

You can use Program Units and Attached Libraries as the same way we use them in the Forms Builder tool.


Property Palette

In the course of our hands-on, you will see that we use Property Palette over and over. In fact you can’t do much without Property Palette. It is very important to understand it. It contains object properties. The contents of the Property Palette are referred to as the “Property sheet” for the object. You use the Property Palette to modify object properties. To open the Property Palette of an object, go to the object and right click on the mouse then select Property Palette.


Questions:

Q: What is an Object Navigator in the Report Builder tool?

Q: What does the Object Navigator contain?

Q: What is a Report Object in the Object Navigator?

Q: What is a Pre-viewer in the Report Builder?

Q: What is a Data Model in the Report Builder?

Q: What is a Layout Model in the Report Builder?

Q: What is a Parameter Form in the Report Builder?

Q: What are the types of parameters?

Q: What is a user parameter?

Q: What is a system parameter?

Q: What are the report triggers?

Q: Describe program units and attached libraries in the report builder?

Q: Describe property palette in the report builder?Q: What is the property sheet for an object


How to write a Tabular report

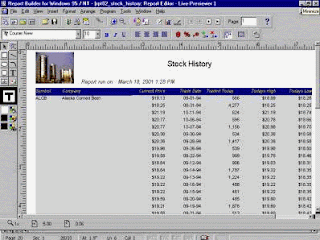
(FIGURE-1)


Tabular
Introduction
Tabular report shows data in a table format. It is similar in concept to the idea of an Oracle table. Oracle, by default, returns output from your select statement in tabular format.

Hands-on
In this Hands-On, your client is a stock broker that keeps track of its customer stock transactions. You have been assigned to write the reports based on their reports layout requirements.
Your client wants you to create a simple listing report to show list of the stock trades by using stocks table for their brokerage company
The user layout format mask requirements are:
For date MM-DD-RR (Year 2000 complaint).
For dollars $99,999.90.
For quantity NNN.N0.
See Figure 1.

Your tasks are:
1- Write a tabular report.
2- Apply user layout Format mask.
3- Run the report.
4- Test the repot.

You will learn how to: use report wizard, object navigator, report builder, “date model”, property palette, work on query and group box, see report style, use tabular style, navigating through report’s record, change the format mask for dollar, numeric and date items.

Figure 1


Open Report Builder tool
Open the "Report Builder" tool.

Connect to database
In the Object Navigator, highlight "Database Objects,” choose "File," then select the "Connect" option.
In the ‘Connect’ window, login as “iself” password schooling, then click “CONNECT.”

Save a report
In the Object Navigator, highlight the "untitled" report, choose “File,” and select the “Save as” option.
In the ‘Save as’ window, make sure to save the report in the ISELF folder and name it "rpt01_stock_history,” report number 1 stock history.

Data Model
In the Object Navigator, double click on the "Data Model" icon.

Create SQL box
In the Data Model window, click on the "SQL Query" icon. Then drag the plus sign cursor and click it anywhere in the “Data Model” screen where you wish your object to be.

In the ‘SQL Query Statement’ window, write a query to read all the stocks record sorted by their symbol.
(SQL Query Statement)
SELECT * FROM stocks
ORDER BY symbol
Click “OK.”

Change SQL box’s name
In the Data Model window, in the “SQL” box, right click on the ‘Q_1’ and open its property palette.
In its property palette, change the name to Q_STOCKS. Then close the window.

Change GROUP box’s name
In the Data Model, right click on the group box (G_SYMBOL) and open its property palette.
In the Group property palette, change the name to ‘G_STOCKS,’ and close the window.

Open Report Wizard
In the Data Model, click on the ‘Report Wizard’ icon on the horizontal tool bar.
In the Style tab, on the Report Wizard window, type ‘Stock History’ in the Title box and choose the report style as ‘Tabular.’
Notice that when you change the report style a layout of that report will be displayed on the screen.
Choose a different style to display its layout of its report style.

Data, Fields, Totals, Labels and Template tabs
Click “NEXT” to go to the Data tab. In the ‘SQL Query Statement’ verify your query.
Click “NEXT” to navigate to the Fields tab, select the fields that you would like to be display in your report. Select all the columns to be display.
Click “NEXT” to navigate to Totals tab, select the fields for which you would like to calculate totals. We have none in this hands-on exercise.

Click “NEXT” to open the Labels tab, modify the labels and widths for your fields and totals as desired.
Click “NEXT” again to go to the Template tab, and choose a template for your report. Your report will inherit the template’s colors, fonts, line widths, and structure.
Use the default template and click “finish.”

Running a report
Now, you should have your output report on the screen.

Resize an object
Maximize the output report and format the report layout. To resize an object , select it and drag its handler to the preferred size.

Move an object
To move an object, select and drag it while the cursor is on the object.

This is a simple report.
Navigate through the output
To navigate through the output report in the Report Editor - Live Pre-viewer, click on the "next page" or "previous page" icon on the horizontal toolbar.
Do the same with the "first page" or "last page" icon.

Use the “zoom in” and “zoom out” icon to preview the report.
Know report’s functions
To know each icon functionalities, drag your cursor on it and a tooltip will display its function.

Change Format Mask
To change the "format mask" of a column, the column should be selected. Then go to the toolbar and click on the “$” icon, "add decimal place," and the “right justify” format to the all currency columns (Todays Low, Todays High, and current price)

Select the “traded today” column, and click on the ‘,0’ icon (apply commas), and make it right justify.
Also, you can change any attributes of field by opening its property palette. To open an object’s property palette, right click on it and select the Property Palette option.
Right click on the "trade date" column and open its "property palette."
Change the date "Format Mask" property and make it “year 2000 complaint (MM-DD-RR).”

Navigate through the report pages.
Save a report
Save the changes (rpt01_stock_history).


Questions
Q: How can you use the "Report Wizard" tool in the "Report Builder" tool?
Q: How can you use the "Object Navigator" window?
Q: How can you write a report?
Q: How can you save a report?
Q: How can you use the "Data Model" tool?
Q: What is the "Property Palette" sheet?
Q: What is the "Query" box in the "Data Model" window?
Q: What is the "Group" box in the "Data Model" window?
Q: How can you change a report style?
Q: Use a tabular style for a report.
Q: How can you navigate through your report?
Q: How can you change a format mask for an item in the "Report Builder" tool?
Q: What is a Tabular report?
Q: Your client is a stock broker that keeps track of its customer stock transactions. You have been assigned to write the reports based on their reports layout requirements.
Your client wants you to create a simple listing report to show list of the stock trades by using stocks table for their brokerage company
The user layout format mask requirements are:
For date MM-DD-RR (Year 2000 complaint).
For dollars $99,999.90.
For quantity NNN.N0.
See Figure 1.

Your tasks are:
1- Write a tabular report.
2- Apply user layout Format mask.
3- Run the report.4- Test the repot.